
Best Power Quality Analyzers in 2026: Buyer’s Guide
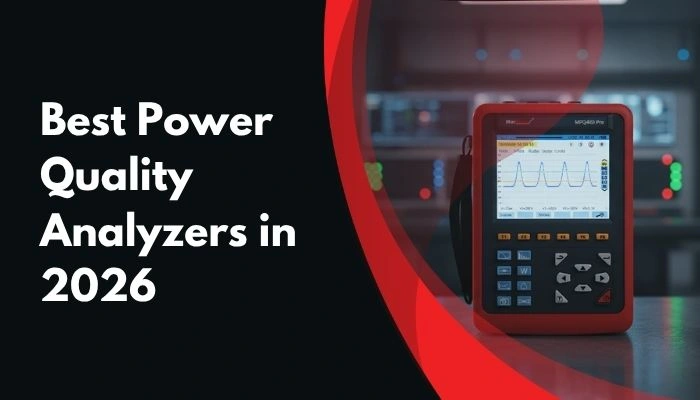
2026 BUYER’S GUIDE
A power quality analyzer reveals what a multimeter or clamp meter never can:
harmonics, voltage sags, swells, transients, flicker and phase unbalance that
quietly trip breakers, overheat motors, corrupt data and increase operating costs.
Harmonics & THD
Three-Phase Analysis
Energy Audits
Troubleshooting
IEC 61000-4-30
Three-Phase Analysis
Energy Audits
Troubleshooting
IEC 61000-4-30
Quick Answer: Which Power Quality Analyzer Should You Buy?
The best power quality analyzer depends on the type of evidence you need. For formal compliance testing and disputes, choose an instrument with verified IEC 61000-4-30 Class A performance. For maintenance surveys and troubleshooting, a capable Class S instrument may provide better value. For energy
audits, prioritise active power, reactive power, apparent power, energy, power factor, harmonics and long-term data logging. For intermittent faults, waveform capture, event triggering and sufficient memory are more important than a large display.
What Is a Power Quality Analyzer?
A power quality analyzer is a specialised electrical test instrument used to measure, record and analyse the quality of voltage and current in an electrical installation.
Unlike a standard multimeter, it does not only show a momentary RMS value. It observes how the electrical system behaves over time and identifies disturbances that may remain invisible during a quick inspection.
In commercial buildings, factories, data centres, hospitals, renewable-energy systems and industrial plants, the most difficult electrical problems are often intermittent.
A machine may stop only when a large motor starts, a variable-frequency drive changes speed or a production line reaches peak demand. A short measurement may miss the event completely. This is why a reliable power quality study combines correct installation, appropriate measurement settings and sufficiently long recording.
Engineering principle:
A symptom is not a diagnosis. “The breaker trips” is a symptom; voltage sag, harmonic overload, inrush current, poor power factor or phase unbalance may be the measurable cause.
What Does a Power Quality Analyzer Measure?
The value of a power quality analyzer comes from combining electrical measurements with time-based analysis. The exact functions vary between models, so buyers should confirm the datasheet rather than assuming that every instrument measures every disturbance.
Voltage and Current
RMS voltage, current, peak values, frequency and waveform behaviour establish the basic condition of the supply.
Power and Energy
Active power, reactive power, apparent power, power factor and accumulated energy support audits and load studies.
Harmonics and THD
Harmonic spectra and total harmonic distortion help identify nonlinear loads and overheating risks.
Events and Disturbances
Sags, swells, interruptions, transients, flicker and unbalance can be recorded for later investigation.
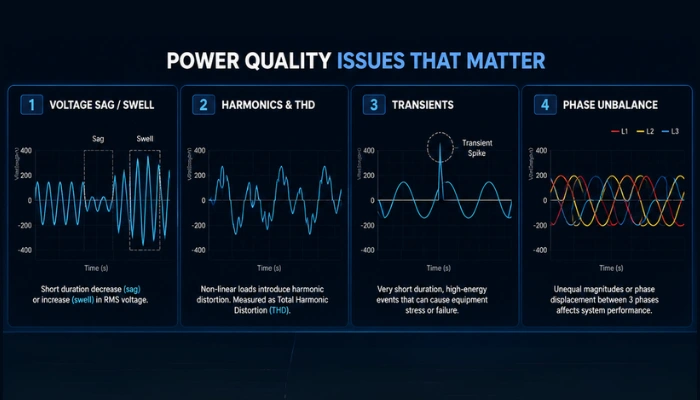
Voltage Sags, Swells and Interruptions
A voltage sag is a temporary reduction in supply voltage, commonly caused by motor starting, short-circuit faults or upstream network events. A swell is a temporary increase in voltage. Even when the average voltage appears normal, these events can reset PLCs, stop variable-speed drives, interrupt data systems and damage sensitive equipment.
Transients and Waveform Distortion
Transients are fast changes that may result from switching, capacitor-bank operation, lightning or inductive load interruption. Capturing them requires suitable sampling, triggering and voltage input protection. A basic voltage display is not enough to explain a fast disturbance.
Phase Unbalance and Flicker
Phase unbalance can increase motor heating and reduce equipment efficiency. Flicker describes visible or perceptible light fluctuation caused by voltage variation. These parameters are especially relevant in installations with large fluctuating loads,welding equipment, compressors and industrial production machinery.
Why Power Quality Matters
Poor power quality is often expensive precisely because it is difficult to see. A facility may replace a motor, PLC or UPS without discovering that the real problem is a recurring voltage event or harmonic current. Measurement reduces guesswork and creates a defensible technical record.
Production Loss
Unexpected trips and resets can stop production and create scrap or downtime.
Thermal Stress
Harmonics and unbalance may increase heating in transformers, motors, cables and neutrals.
Capacity Loss
Low power factor causes higher current for the same useful power and may reduce available system capacity.
Unexplained Faults
Long-term logging connects equipment symptoms to the exact time and electrical conditions of an event.
The goal is not simply to collect more numbers. The goal is to connect an electrical event to a physical consequence and then select a proportionate corrective action.
Power Quality Analyzer Comparison Table
Use this table as a practical screening tool. The correct instrument is the one whose measurement class, channels, logging functions, safety category and software match the task. Do not select an analyzer only by display size or the number of headline parameters.
| Buying Criterion | Good for | What to verify | Why it matters |
|---|---|---|---|
| IEC 61000-4-30 Class A | Compliance and formal investigations | Manufacturer’s declared compliance and supported parameters | Produces more defensible and comparable measurements |
| Class S | Surveys and troubleshooting | Accuracy, event functions and logging depth | Often offers practical field capability at lower cost |
| Three-phase capability | Industrial and commercial systems | 3P3W/3P4W wiring modes, phase rotation and neutral measurement | Prevents incomplete or incorrectly mapped studies |
| Harmonic analysis | VFDs, UPS systems, LED loads and data centres | Harmonic order, THD, voltage/current harmonics and trend logging | Identifies distortion and likely nonlinear sources |
| Waveform capture | Nuisance trips and intermittent events | Trigger thresholds, pre-trigger memory and event records | Shows what happened immediately before and after a fault |
| Long-term logging | Energy audits and recurring faults | Memory, interval settings, battery and data export | Captures daily, weekly and load-dependent patterns |
| Safety rating | Live-panel measurements | CAT III/CAT IV rating, input limits and accessories | Protects the operator and the instrument |
| PC software and reporting | Consultants and engineering teams | Data formats, automatic reports and time synchronisation | Turns raw readings into a usable technical report |
Key Specifications to Compare Before Buying
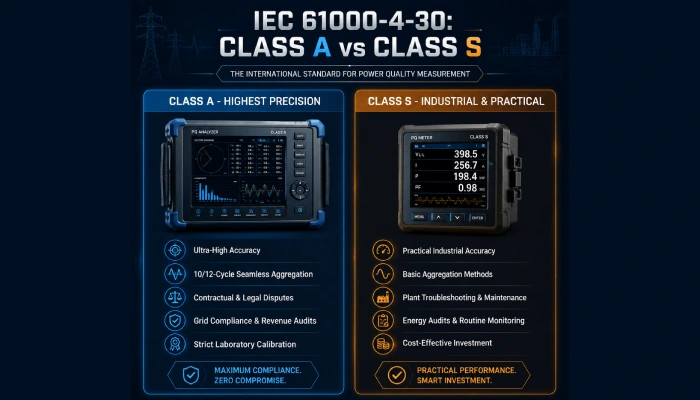
1. Measurement Class: Class A or Class S?
Measurement class is one of the most important distinctions in power quality testing. A Class A instrument is intended for standardised, highly repeatable measurements and is the appropriate choice when results may be used for compliance assessment, contract review or a dispute. Class S instruments are commonly used for surveys, maintenance and troubleshooting, but their exact capabilities still depend on the manufacturer and model.
2. Phase Configuration and Current Sensors
For industrial installations, confirm support for three-phase three-wire and three-phase four-wire systems. Also check the current input method, compatible CTs, flexible probes, clamp range and whether the accessories are included or optional. A technically advanced analyzer is not useful if its sensors cannot fit the conductors or measure the expected current range.
3. Harmonic Order, THD and Sampling
Harmonic analysis should include both voltage and current where possible. Total harmonic distortion gives a summary, while the individual harmonic spectrum helps identify the likely source. Fast disturbances require suitable sampling and event capture; logging RMS trends alone may not reveal the mechanism behind a failure.
4. Memory, Logging Interval and Waveform Recording
For intermittent faults, memory and event handling are often more valuable than a sophisticated live screen. Look for configurable logging intervals, timestamped events, pre-trigger waveform capture, trend graphs and simple export to analysis software.
5. Safety and Installation Category
Power quality measurements are frequently performed on distribution boards and live industrial panels. Verify the analyzer’s CAT rating, maximum input voltage, current sensor insulation, test leads and connection accessories. Always follow local safety procedures, lockout/tagout requirements and the manufacturer’s instructions.
How to Choose a Power Quality Analyzer by Use Case
Energy Audits
Select an analyzer with active, reactive and apparent power, energy accumulation,
power factor, current demand and long-term logging. Harmonic data is useful when
evaluating transformer loading or nonlinear loads.
Priority: power, energy, PF, logging and reporting.
Compliance Testing
Choose a verified Class A power quality analyzer when measurements must be compared
against applicable standards or presented as formal evidence. Confirm the required
parameters, interval aggregation and report format.
Priority: Class A, traceability and standardised reports.
Troubleshooting
For nuisance trips and unexplained shutdowns, choose event triggering, waveform
capture, sags/swells, transients, phase information and adequate memory. The
analyzer must continue recording while the fault is absent.
Priority: event capture, triggers and time correlation.
Motors and Drives
Voltage unbalance, current unbalance, harmonics and power factor are important when
investigating motors, pumps, compressors and variable-frequency drives.
Priority: three-phase measurements, harmonics and unbalance.
FEATURED SOLUTION
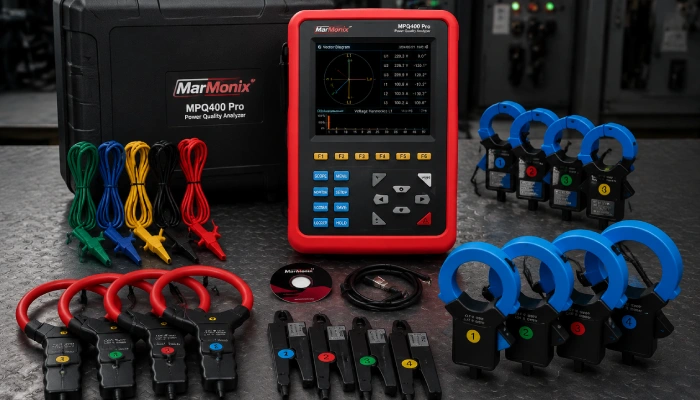
MarMonix MPQ400 Pro Power Quality Analyzer
The MarMonix MPQ400 Pro is positioned for three-phase power quality analysis, energy auditing and field troubleshooting. Its primary value is not simply displaying voltage and current; it is the ability to build a time-based picture of the electrical system and relate measured events to real equipment behaviour.
Where It Delivers Value
- Three-phase electrical measurements for commercial and industrial installations.
- Power and energy studies where load behaviour changes during the day.
- Harmonic and power factor investigations.
- Longer monitoring periods for intermittent or load-dependent faults.
- Field reports based on recorded evidence rather than a single instant reading.
MarMonix MPQ400 Pro: Buyer Verification Checklist
Before purchase, confirm the exact datasheet revision for measurement class, supported wiring configurations, harmonic order, transient capability, current-probe options, memory capacity, battery runtime, CAT rating and analysis software. These specifications can vary by configuration and should not be inferred from the product name alone.
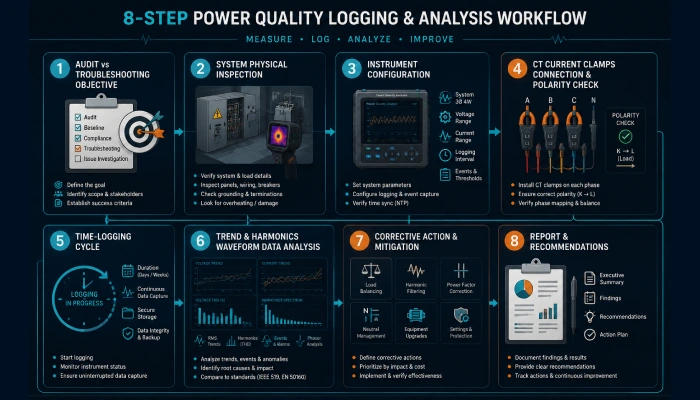
How to Run a Reliable Power Quality Study
Even the best power quality meter can produce misleading conclusions if it is connected
incorrectly or operated for too short a period. Use a repeatable field procedure.
- Define the question. Decide whether the objective is an energy audit, compliance assessment, equipment fault investigation or baseline survey.
- Inspect the installation. Record nominal voltage, frequency, system grounding, load type, phase arrangement and the equipment affected.
- Verify the analyzer. Check battery, memory, time and measurement settings before connecting to the panel.
- Connect carefully. Confirm phase mapping, phase rotation, voltage lead placement and CT polarity. Reversed CTs can produce incorrect power and power-factor readings.
- Record context. Note production shifts, motor starts, HVAC cycles, generator operation and major switching events.
- Log for a representative period. A full working cycle is a useful minimum; a week is often preferable when daily and weekly patterns matter.
- Analyse trends and events together. Compare voltage, current, power, THD, unbalance and event timestamps instead of viewing each parameter in isolation.
- Write a corrective-action report. State the observed condition, evidence, likely cause, risk, recommended remedy and any follow-up measurement.
Professional tip:
Install the analyzer as close as practical to the affected equipment, then compare the results with the upstream supply if the fault source is unclear. This helps distinguish an incoming utility disturbance from a problem generated inside the facility.
Install the analyzer as close as practical to the affected equipment, then compare the results with the upstream supply if the fault source is unclear. This helps distinguish an incoming utility disturbance from a problem generated inside the facility.
Harmonics and Power Factor Explained
Where Harmonics Come From
Nonlinear loads do not draw current as a perfectly smooth sine wave. Variable-speed drives, uninterruptible power supplies, LED drivers, battery chargers, computers and switch-mode power supplies may draw current in pulses. These current components occur at multiples of the fundamental frequency and are known as harmonics.
Total harmonic distortion, commonly written as THD, summarises the distortion relative to the fundamental component. However, THD alone does not identify the source. The individual harmonic spectrum, current level, load state and time trend are needed for a meaningful diagnosis.
THD is a warning indicator, not a complete diagnosis.
Always interpret distortion alongside load current, transformer loading, neutral current and system configuration.
The Cost of Poor Power Factor
Power factor indicates how effectively an electrical system converts supplied current into useful active power. A low power factor increases current for a given real-power demand. The result can include additional losses, reduced available capacity, larger voltage drop and, depending on the tariff, utility penalties.
Corrective action may involve capacitor banks, active power-factor correction, harmonic filters, load redistribution or equipment changes. Correction should be designed from measured data because capacitor banks can interact with harmonic-producing loads and create resonance risks.